Overview #
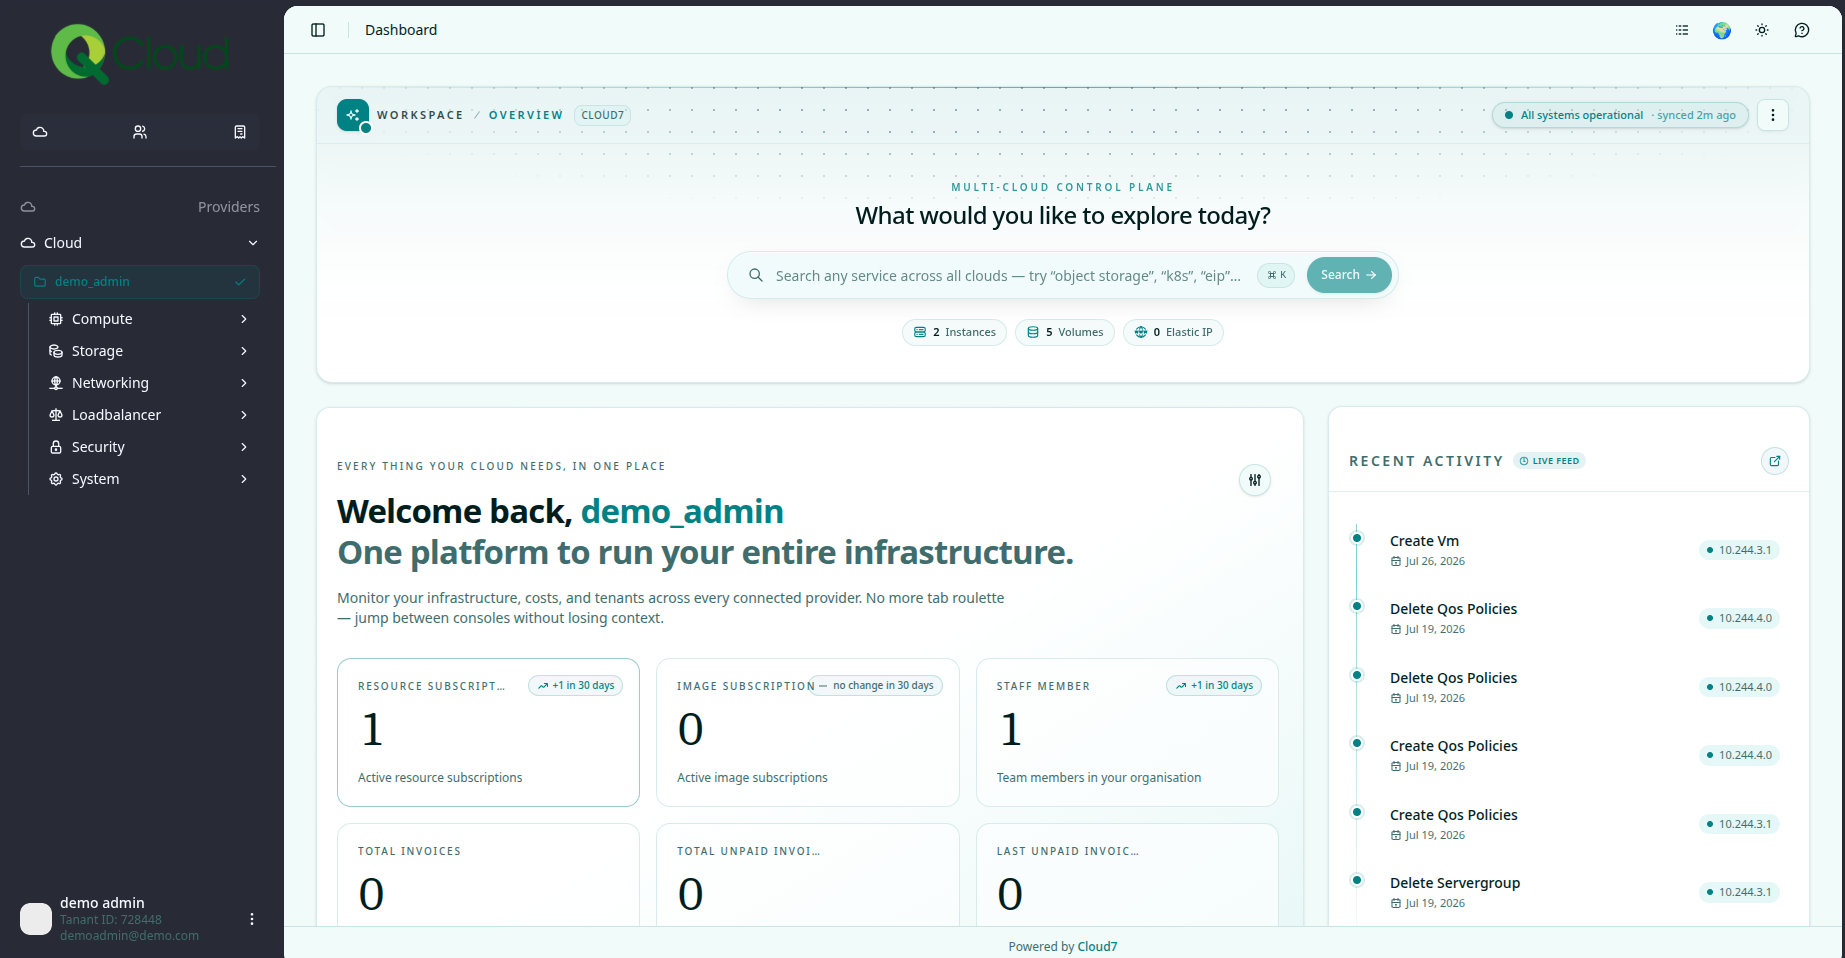
After a successful login, QCloud redirects you to the Customer Dashboard. Here you’ll see a welcome widget displaying your last login details, along with your last invoice details and total due payments.
The dashboard also shows a resource summary graph with the total count of your cloud resources virtual instances, volumes, and IP addresses along with separate graphs for individual resource records.
#
Dashboard Widgets #
The dashboard is made up of multiple widgets, each surfacing a different summary of your account and resources at a glance:
- Welcome / Account widget last login details, latest invoice, and total amount due.
- The Invoice and Dues widgets shows you the information on your invoices and pending payments. It also inform you on the status of your last invoice to help remind pending payments.
- Resource Summary widget — total counts across virtual instances, volumes, and IP addresses.
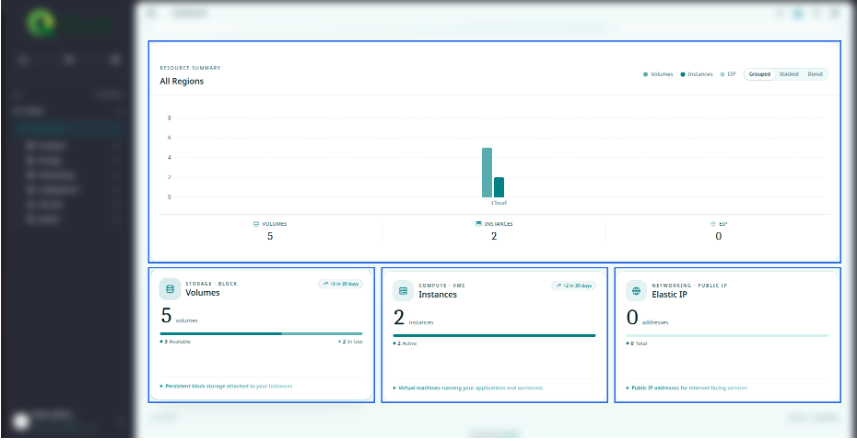
#
Menu Structure #
Left-Hand Menu #
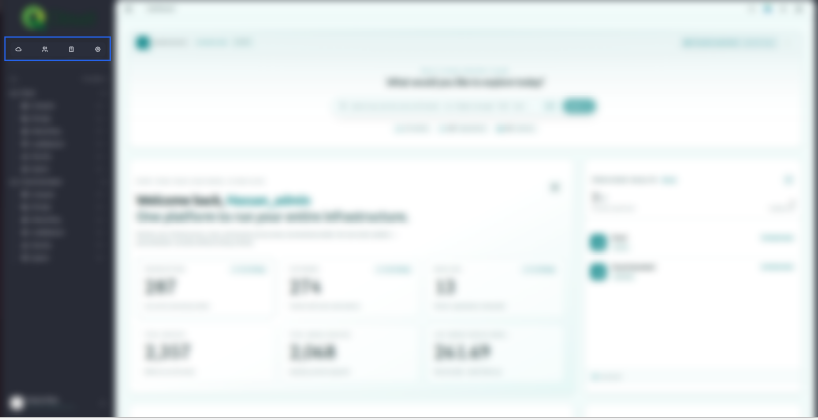
The left side menu has three core sections, each with further sub-menus for related features:
- Providers — access to compute, storage, and networking services (Virtual Instances, Keypairs, Elastic Volumes, Networks, Routers, Security Groups, etc.).
- User Management & Services — identity and access controls for your organization’s users.
- Billing & Reports — invoices, payment history, and usage reports.
- Configuration — Providers & Regions, Notification, General settings, Panel Management.
Top-Right Menu #
The upper-right area of the console includes:
- A region selection drop-down to switch between availability regions.
- A logging menu covering Audit Logs, Login Logs, and Email Logs.
- Help-Desk & Message Center for support tickets and notifications.
- A language pack selector.